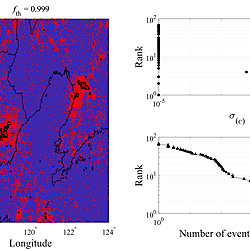
Statistics on seismicity clustering. The left picture depicts the geographic extents of clusters defined by a certain density threshold fth (yellow domains) and recorded earthquakes with mL≥3 (red dots). The upper-right graphic depicts the relative change in the number of earthquakes, σ(c), as described in Equation (2), for several clusters, sorted by the number of earthquakes in each location. To guarantee visibility on the logarithmic x-axis, values for σ(c) = 0 are set to 10−5. The lower-right graphic shows the rank-order distribution of earthquakes across the various clusters.