- Repository URL
- https://github.com/open-and-sustainable/prismaid_manual
Monthly Archives: May 2025
A network of flux towers measures changes in methane fluxes at the ecosystem scale throughout a boreal mire complex
Variations in ecosystem-scale methane fluxes across a boreal mire complex assessed by a network of flux towers
Abstract
This dataset contains high-resolution observations of methane (CH4) fluxes and related environmental factors from a boreal mire complex in northern Sweden. The dataset includes three years of continuous monitoring (2020-2022) using a network of four eddy-covariance flux towers, giving detailed geographical and temporal data on ecosystem-scale methane dynamics.
Dataset Contents
Methane fluxes measured by half-hourly eddy covariance (2020–2022)
2020–2022 environmental drivers include:
Gross primary production
Temperature of the soil
depth of the water table
Methane concentration measurements in peat pores (2022)
Normalized Difference Vegetation Index (NDVI) generated from Sentinel 2 satellites (2020–2022)
Data files
May 01, 2025 version files8.34 MB
- Archive_KRI_CH4_dynamics.zip
8.34 MB
- README.md
4 KB
FigS1-Clusters

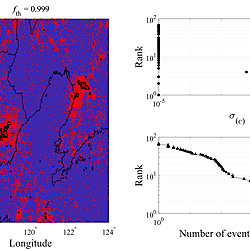
Statistics on seismicity clustering. The left picture depicts the geographic extents of clusters defined by a certain density threshold fth (yellow domains) and recorded earthquakes with mL≥3 (red dots). The upper-right graphic depicts the relative change in the number of earthquakes, σ(c), as described in Equation (2), for several clusters, sorted by the number of earthquakes in each location. To guarantee visibility on the logarithmic x-axis, values for σ(c) = 0 are set to 10−5. The lower-right graphic shows the rank-order distribution of earthquakes across the various clusters.
FigS4-Φ

Figures S4. Equation (3) shows the relationship between Φ and NΦ (NΦ = 1, 2,…, 15), specifically the sum of σ(c) for the top NΦ spatial cluster areas, and density threshold fth.
FigS5-HaichengCCFMD_DK

The pre-mainshock, post-mainshock, and combined pre-mainshock and post-mainshock sequences of the mL 7.4 Haicheng earthquake on February 4, 1975, are shown in Figure S5 as magnitude rank-ordering plots (non-normalized complementary cumulative frequency-magnitude distribution, CCFMD) for various density threshold fth.
Based on the completeness magnitude mc (vertical gray line) and the dragon-king earthquake candidate transition magnitude mt (vertical gray dashed line), the testing framework for the dragon-king earthquake separates the frequency-magnitude distribution into three different regions: the incomplete part (light gray solid circles), the Gutenberg-Richter part (dark gray solid circles), and the dragon-king candidate part (black solid circles).